Joseph J. Mangano, MPH, MBA
Executive Director
Radiation and Public Health Project
May 13, 2008
TABLE OF CONTENTS
(Click on the underlined chapter heads to go to that chapter.)
Executive Summary
I. Introduction
A. Brief History of Nuclear Power and Indian Point
B. Radioactivity Produced in Reactors
II. Health Hazards Posed by Reactor Meltdowns
A. Description
B. Estimates of Casualties
III. Radioactivity from Indian Point
A. Environmental Releases from Indian Point
B. Radioactivity Levels in Bodies Near Indian Point
IV. Potential Health Risks from Indian Point in Fairfield County
A. Rises in Connecticut Childhood Cancer
B. Fairfield County as a Low-Risk Area
C. Low Weight Births
D. Cancer Incidence
E. Cancer Mortality
V. Studies of Improved Health After Reactor Shutdown
A. Precedent – Atomic Bomb Testing Halt
B. Precedent – Nuclear Reactor Closing
C. Potential Cancer Reductions After Indian Point Closing
EXECUTIVE SUMMARY
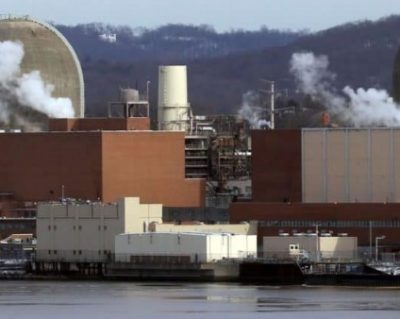
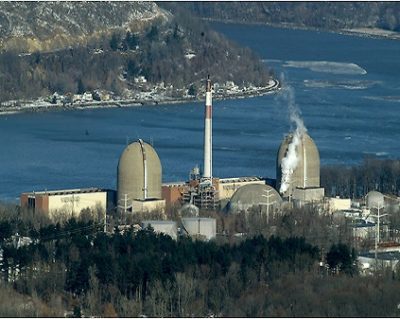
The Indian Point nuclear plant, 35 miles north of midtown Manhattan, has three reactors, two of which remain in operation. Entergy Nuclear, which operates the plant, has requested that the federal government extend the operating licenses of the two reactors for 20 additional years beyond their 2013 and 2015 expiration dates. To date, federal officials have not acknowledged any public health risks of license extension at Indian Point. This report explores risks from Indian Point license extension to Fairfield County.
Continued operation of Indian Point raises the risk of radioactivity exposure in two ways. First, the reactor cores would produce high-level waste to be added to the 1,500 tons already at the site, worsening the consequences of a large-scale release. Second, because reactors routinely release radioactivity, keeping Indian Point in service would mean greater releases and risks to local residents.
Fairfield County, CT is located to the east-southeast of Indian Point, 18 miles away at its closest point in Greenwich and 45 miles away at its most distant in Stratford. The principal health risks Indian Point poses to the county, detailed in the report, are:
- A large-scale release of radioactivity in a meltdown, from mechanical failure or act of sabotage, would harm thousands of Fairfield residents by radiation poisoning or cancer.
- Indian Point has released the 5th greatest amount of airborne radioactivity out of 72 U.S. nuclear plants. In some periods, releases are up to 100 times greater than normal.
- Levels of Strontium-90 in Fairfield County baby teeth are the highest in the New York metropolitan area, with the exception of the New York counties closest to Indian Point
- The recent rate of babies born underweight in Fairfield County exceeds U.S. rates by 3%, 12%, 3%, and 32% for whites, blacks, Asians, and Hispanics
- Recent cancer incidence in Fairfield County is 8% and 7% above the U.S. rate for males and females
- The portion of Fairfield County with the highest cancer incidence rates are the towns in the southwest part of the county, directly downwind and closest to Indian Point
- The Fairfield County death rate for children and adolescents (under age 25) is 4% above the U.S. rate, but 20% below for all other causes.
While many factors contribute to cancer risk, evidence suggests that more detailed study on Indian Point is warranted, and that residents of Fairfield County be informed of any potential health risks, as federal regulators consider Entergy Nuclear’s proposal to extend the Indian Point licenses for 20 years. Sound public policy would mandate that Entergy prove the reactors do not harm local residents as a condition for license extension.
I. Introduction
A. Brief History of Nuclear Power and Indian Point
The discovery of nuclear fission, or creation of high energy by splitting uranium atoms, was first used for military purposes, i.e. the atomic bombs in Japan during World War II. Soon after, other uses of the fission process were introduced. One of these was the creation of electric power from the heat generated by fission. The “Atoms for Peace” speech given at the United Nations by President Dwight Eisenhower in 1953 opened the door for the development of reactors that would produce electricity.
Hundreds of reactors were proposed by electric utilities, who were interested based on the potential to produce clean and cheap energy. In the New York City area, many reactors were discussed, and applications were submitted to federal regulators for 16 reactors within 100 miles of midtown Manhattan. Of these, only five eventually operated and only three still remain in operation (Indian Point 2, Indian Point 3, and Oyster Creek).
The Indian Point plant is the former site of an amusement park in the town of Buchanan, in northwestern Westchester County. It is located on the Hudson River, the source of power needed to operate the plant. Five reactors were expected at the site; however, the Verplanck 1 and 2 reactors were cancelled in the 1970s, and the Indian Point 1 reactor closed permanently in 1974.
Indian Point 2 and 3 have the capacity to generate 951 and 965 megawatts of electricity, respectively, much more than the Indian Point 1 capacity of 257. The reactors went critical (began producing radioactivity) on May 22, 1973 and April 6, 1976, respectively. To date, no U.S. reactor has operated longer than 39 years, making the 35 and 32 year-old Indian Point reactors among the oldest (19th and 42nd oldest of 104 U.S. reactors).
B. Radioactivity Produced in Reactors
To produce electricity, nuclear power reactors split uranium-235 atoms, generating high energy that is transformed into electrical power. This splitting process, known as fission, also produces over 100 chemicals not found in nature. These chemicals are the same as those found in the large clouds of fallout after above-ground atomic bomb tests.
Fission products, which take the form of gases and particles, include Cesium-137, Iodine-131, and Strontium-90. They are highly unstable atoms which emit alpha particles, beta particles, or gamma rays. When they enter the body, they affect various organs. Cesium seeks out the muscles (including the heart and reproductive organs), iodine attacks the thyroid gland, and strontium attaches to bone. Each causes cancer after damaging DNA in cells and creating mutations, and is especially harmful to the fetus, infant, and child. Some decay quickly (Iodine-131 has a half life of 8 days), while others remain for long periods (Strontium-90 has a half life of 29 years).
Most of the radioactivity produced in reactors is contained within the reactor building and stored as high-level waste in deep pools of water that must be constantly cooled. At Indian Point and at other aging plants, the pools are becoming full. Some of the waste has been transferred to above-ground outdoor casks, and this process is expected to begin at Indian Point in late 2007. Indian Point currently maintains over 1,500 tons of waste on site, and additional radioactivity in the reactor cores. The amount of radioactivity at the plant is equivalent to several Chernobyls, and hundreds of Hiroshima bombs.
The federal government has designated Yucca Mountain in Nevada as a permanent site for high level nuclear waste. Yucca has encountered much opposition, and will not open until at least 2018 (according to the U.S. Energy Department). Some experts believe that Yucca Mountain or any permanent repository will never open, leaving existing nuclear plants to maintain the waste indefinitely.
II. Health Hazards Posed by Reactor Meltdowns
A. Description
Much of the health concern posed by nuclear reactors is on the effects of a major meltdown. The radioactivity in a reactor core and waste pools must be constantly cooled by water, or the fuel will overheat, causing a huge release of radioactivity. This release can be caused by mechanical failure (such as what happened at Chernobyl in 1986) or by a deliberate act of sabotage.
Hiroshima and Nagasaki showed how high levels of radioactivity can harm humans. Those closest to the bombs were vaporized, literally melting from the intense heat. But many other victims who survived the blast developed acute radiation poisoning, marked by nausea, vomiting, diarrhea, skin burns, weakness, dehydration, bleeding, hair loss, ulcerations, bloody stool, and skin sloughing, according to the Medical Encyclopedia of the National Library of Medicine. A large number of bomb survivors also developed cancers over the next several decades; thyroid cancer had the greatest excess. (Source: Thompson DE et al. Cancer Incidence in Atomic Bomb Survivors. Part II: Solid Tumors, 1958-1987. Radiation Effects Research Foundation, Hiroshima Japan, 1994).
B. Estimates of Casualties.
If a meltdown that caused large scale releases of radioactivity from the reactor core or the waste pools occurred at Indian Point, there would be no vaporizing of humans. However, many would suffer from acute radiation poisoning (short term) and cancer (long term). Several estimates have been made to calculate just how many would be harmed. In 1982, the Sandia National Laboratories submitted estimates to Congress for each U.S. nuclear plant (Indian Point estimates are in Table 1).
| Table 1 Estimated Deaths/Cases of Acute Radiation Poisoning and Cancer Deaths Near Indian Point, Following a Core Meltdown | ||
| Type of Effect | Indian Point 2 | Indian Point 3 |
| Deaths, Acute Radiation Poisoning | 46,000 | 50,000 |
| Cases, Acute Radiation Poisoning | 141,000 | 167,000 |
| Cancer Deaths | 13,000 | 14,000 |
| Note: Acute radiation poisoning cases/deaths calculated within 17.5 miles from the plant, cancer deaths within 50 miles from the plant. Source: Sandia National Laboratories, Calculation of Reactor Accident Consequences (CRAC-2) for U.S. Nuclear Power Plants. Prepared for U.S. Congress, Subcommittee on Oversight and Investigations, Committee on Interior and Insular Affairs. November 1, 1982. |
The Sandia figures are known as CRAC-2 (for Calculation of Reactor Accident Consequences). CRAC-2 estimated casualties for Indian Point are one of the highest of any U.S. nuclear plant. Many believe the figures should be much larger, since the local population has grown since 1982 when the calculations were made, and people beyond a 17.5 mile radius from the plant will also suffer adverse health consequences.
More recently, the Union of Concerned Scientists prepared an estimate of casualties after a core meltdown from a terrorist attack. The 2004 report entitled “Chernobyl on the Hudson” estimated much higher casualties than did the 1982 Sandia effort. The Union’s Dr. Edwin Lyman calculated that as many as 44,000 near term deaths from acute radiation syndrome within 50 miles and 518,000 long term deaths from cancer within 60 miles could occur, depending on weather conditions. (Source: Lyman ES, Chernobyl on the Hudson?: The Health and Economic Impacts of a Terrorist Attack on the Indian Point Nuclear Plant.” Washington DC: Union of Concerned Scientists, 2004. www.ucsusa.org).
Indian Point is more vulnerable to a meltdown from mechanical failure than most reactors because of its age, and more vulnerable to a terrorist attack due to its proximity to New York City. Since the terrorist attack on the World Trade Center of September 11, 2001, much attention has been paid to the Indian Point as a potential terrorist target.
The reactors are also more vulnerable to a meltdown due to its parts corroding as the plant ages and as the reactors operate much more of the time in recent years; the operating factor from 2001-2004 was 94.6% and 95.6% for the two reactors (average 95%), an increase from the pre-1995 factors of 64.7% and 50.4% (average 58%). Source: U.S. Nuclear Regulatory Commission, in The New York Times, October 2, 1995.
The potential for a meltdown, while not highly likely, is a reality. A recent report by Greenpeace entitled “An American Chernobyl” identified 200 near-miss accidents at American reactors in the past two decades, four at Indian Point, all since 2000 (Table 2).
| Table 2 Near Miss Accidents At Indian Point Since 1986 | ||
| Date | Reactor | Description |
| February 15, 2000 | Indian Point 2 | Steam generator tube rupture |
| July 19, 2002 | Indian Point 2 | Degraded control room fire barrier |
| August 14, 2003 | Indian Point 2 | Loss of offsite power due to NE blackout |
| August 14, 2003 | Indian Point 3 | Loss of offsite power due to NE blackout |
| Source: An American Chernobyl: Nuclear “Near Misses” at U.S. Reactors Since 1986. Washington DC: Greenpeace, 2006. www.greenpeace.org. |
III. Radioactivity from Indian Point
A. Environmental Releases from Indian Point
All nuclear reactors must routinely emit radioactivity into the environment in order to operate. There are several forms of these emissions. One is accidental releases due to leaking equipment, which can include the cladding and welds of fuel rods in the reactor core, cracks and breaks in fuel that damages cladding, corroding pipes, and cracked steam generator tubes. These scenarios result in radioactivity released into the air and water. Radioactivity is also deliberately released into the local environment about every 18 months when reactors refuel.
Each utility is required by federal law to measure and report annual radioactive environmental emissions from nuclear reactors. From 1970-1993, the federal government produced a comparative listing of annual emissions for each U.S. reactor (it has since been discontinued). One measure of environmental emissions is known as airborne “Iodine-131 and Effluents” or chemicals with a half life of at least eight days (and thus, are more likely to enter the body through breathing and the food chain). The list of the U.S. nuclear plants with the highest releases is given in Table 3:
| Table 3 US Nuclear Plants with Highest Emissions Of Airborne Radioactivity, 1970-1993 | |||
| Plant | Location | Reactors | Emissions* |
| 1. Dresden | Morris IL | 3 | 97.22 |
| 2. Oyster Creek | Forked River NJ | 1 | 77.05 |
| 3. Millstone | Waterford CT | 2 | 32.80 |
| 4. Quad Cities | Cordova IL | 2 | 26.95 |
| 5. Indian Point | Buchanan NY | 3 | 17.50 |
| 6. Nine Mile Point | Scriba NY | 2 | 14.67 |
| 7. Brunswick | Southport NC | 2 | 14.50 |
| 8. Three Mile Island | Londonderry PA | 2 | 14.43 |
| * * Curies of Iodine-131 and effluents Source: Tichler J et al. Radioactive Materials Released from Nuclear Power Plants, annual reports. Upton NY: Brookhaven National Laboratory, NUREG/CR-2907. |
The Indian Point total of 17.50 curies is the 5th highest of 72 U.S. plants, greater than the 14.43 curies from the Three Mile Island plant in Pennsylvania. Most of the Indian Point total occurred in 1985 and 1986, with a total of 14.03 curies from Indian Point 2. Several years later, totals were changed to 1.90 curies; the U.S. Nuclear Regulatory Commission attributed the change to a “clerical error.” While original figures are used here, revised figures would still rank Indian Point as the 12th highest in the nation.
More recent data on emissions is posted on the Internet by the federal government. Data for all U.S. reactors are listed from 2001-2004, by quarter, and by type of emission. No information for Indian Point 2 is given, and data for Indian Point 3 is incomplete. But examination of types of airborne and liquid radioactive emissions with complete data for each quarter from 2001-2004 from Indian Point 3 is helpful in understanding the large variations over time (Tables 4 and 5).
For example, fission gases rose about six-fold from 4th quarter 2001 to the 1st quarter 2002 (about 15-fold for Xenon-133), about 100 times higher than 1st quarter 2001. Second quarter 2004 airborne fission gases were much higher than typical 2003 releases. More analysis is needed to understand reason(s) for these releases. But it is clear that there are very large swings in emissions levels over time.
| Table 4 Airborne Radioactivity Released from Indian Point 3 In Millicuries by Quarter, 2001-2004 | |||
| Total Millicuries | |||
| Quarter | Xenon-133 | Fission Gases | Tritium |
| 1st Q 01 | 59 | 91 | 360 |
| 2nd Q 01 | 218 | 251 | 457 |
| 3rd Q 01 | 321 | 1040 | 1120 |
| 4th Q 01 | 378 | 1400 | 1430 |
| 1st Q 02 | 5580 | 8180 | 1310 |
| 2nd Q 02 | 1820 | 3790 | 1670 |
| 3rd Q 02 | 166 | 202 | 1540 |
| 4th Q 02 | 33 | 55 | 679 |
| 1st Q 03 | 141 | 181 | 495 |
| 2nd Q 03 | 190 | 229 | 828 |
| 3rd Q 03 | 371 | 525 | 951 |
| 4th Q 03 | 523 | 1590 | 830 |
| 1st Q 04 | 144 | 204 | 1420 |
| 2nd Q 04 | 1290 | 1450 | 1340 |
| 3rd Q 04 | 29 | 58 | 1140 |
| 4th Q 04 | 36 | 121 | 1570 |
| One millicurie is 1/1000th of a curie. The physical half lives of Xenon-133 and Tritium are 5.24 days and 12.3 years, respectively. Source: U.S. Nuclear Regulatory Commission. www.reirs.com/efflunt/EDB |
| Table 5 Liquid Radioactivity Released from Indian Point 3 In Millicuries by Quarter, 2001-2004 | ||
| Quarter | Fission and Activation Products | Tritium |
| 1st Q 01 | 27.0 | 251,000 |
| 2nd Q 01 | 51.4 | 170,000 |
| 3rd Q 01 | 36.4 | 22,900 |
| 4th Q 01 | 12.0 | 482,000 |
| 1st Q 02 | 4.5 | 31,900 |
| 2nd Q 02 | 2.5 | 19,600 |
| 3rd Q 02 | 7.6 | 51,400 |
| 4th Q 02 | 14.0 | 692,000 |
| 1st Q 03 | 3.9 | 667,000 |
| 2nd Q 03 | 27.3 | 61,800 |
| 3rd Q 03 | 7.5 | 187,000 |
| 4th Q 03 | 6.3 | 38,500 |
| 1st Q 04 | 3.1 | 28,800 |
| 2nd Q 04 | 3.0 | 71,800 |
| 3rd Q 04 | 4.7 | 44,900 |
| 4th Q 04 | 4.8 | 530,000 |
| One millicurie is 1/1000th of a curie. The physical half life of Tritium is 12.3 years. Source: U.S. Nuclear Regulatory Commission. www.reirs.com/effluent/EDB |
B. Radioactivity Levels in Bodies near Indian Point
The question of how much man-made radioactivity enters human bodies was first considered in the 1950s, when the U.S. government sponsored studies that measured bone and teeth samples for Strontium-90, one of the 100-plus chemicals found in nuclear weapon explosions and nuclear reactor operations. A landmark study of baby teeth in St. Louis found that the average Sr-90 level for children born in 1964 (just as atomic bomb testing was stopped) was about 50 times greater than for children born in 1950. Furthermore, Sr-90 studies found that average concentrations in bodies plunged by about half from 1964 to 1969, after large-scale weapons testing in the atmosphere was banned. Similar studies of Sr-90 in bone and teeth in Europe found similar patterns. (Sources: Rosenthal HR. Accumulation of environmental strontium-90 in teeth of children. In: Proceedings of the Ninth Annual Hanford Biology Symposium, Richland WA, May 5-8, 1969. Washington DC: U.S. Atomic Energy Commission, 1969. Health and Safety Laboratory, U.S.Atomic Energy Commission. Strontium-90 in Human Vertebrae. In: Radiation Data and Reports, monthly volumes, 1964-1969).
Government officials dropped their in-body radiation monitoring programs in 1970, 1971, and 1982. No studies measuring in-body levels near U.S. nuclear plants existed until 1996, when the independent research group Radiation and Public Health Project initiated an effort measuring Sr-90 in baby teeth. RPHP used a machine designed to measure low-dose radioactivity levels and selected the REMS radiochemistry lab of Canada to establish protocols and test teeth.
The lab calculated the ratio of Sr-90 to calcium, and RPHP converted it to a ratio at birth, using the Sr-90 half life of 28.7 years. Most Sr-90 in a baby tooth is taken up during the last six months of pregnancy and the first few months of life. A tooth from a person age 28.7 years with a current ratio of 4.30 would have an at-birth ratio of 8.60. Teeth were classified according to where the mother lived during pregnancy and the first year of life, not the current residence.
RPHP has tested nearly 5,000 baby teeth, and published five medical journal articles on results. Average Sr-90 in baby teeth was 30-50% higher in counties closest to six U.S. nuclear plants, and rose about 50% from the late 1980s to the late 1990s (reversing a prior decline), as reactors aged and were in operation more frequently. Results were statistically significant, suggesting strongly that reactor emissions were entering human bodies. (Source: Mangano JJ et al. An unexpected rise in Strontium-90 in US deciduous teeth in the 1990s. The Science of the Total Environment 2003;317:37-51).
Over 500 teeth were collected and tested from the New York metropolitan area partly supported by a $25,000 grant from the Westchester County legislature. The average local Sr-90 level was highest in the four New York counties closest to Indian Point – Westchester, Rockland, Orange, and Putnam (3.78 picocuries per gram of calcium), followed closely by Fairfield County CT (3.45). The average in Fairfield exceeded both New York City (3.10) and Long Island (2.75). See Table 6.
| Table 6 Average Strontium-90 in Baby Teeth New York Metropolitan Area | ||
| Region | Teeth | Average Sr-90 |
| 4 Counties Near Indian Point | 279 | 3.78 |
| Fairfield County | 32 | 3.45 |
| New York City | 161 | 3.10 |
| Long Island | 94 | 2.75 |
| Average = picocuries of Sr-90 per gram of calcium at birth. Only births after 1979 included. Source: Radiation and Public Health Project |
While the tooth study provided some unique and important data, it is difficult to demonstrate exactly how the Sr-90 entered children’s bodies. (Some is from the mother’s bone stores, some through the mother’s diet during pregnancy, and some through the baby’s diet during infancy). Sr-90 enters bodies through milk, water, vegetation, and breathing. These limits do not, however, negate the importance of consistent and significant findings of high and rising levels of radioactivity closest to Indian Point.
IV. Potential Health Risks from Indian Point in Fairfield County
A. Rises in Connecticut Childhood Cancer
Evidence suggests that exposure to fission products may have increased the risk of cancer in Connecticut – especially in children, who are most susceptible to radiation. Historical data shows that cancer in the youngest children – which most likely reflects harm during pregnancy – rose during above ground atomic bomb tests, and when nuclear reactors in and near the state operated.
Atmospheric nuclear weapons tests began in 1946 and ended in 1963. Connecticut cancer incidence age 0-4 from the late 1940s to the early 1960s rose from 14.86 to 19.37 cases per 100,000, up 30.3%. From 1967-1975, an additional five nuclear reactors in or near Connecticut began operating, two at Millstone, one at Connecticut Yankee, and two at Indian Point. Cancer incidence age 0-4 in the state rose from 15.28 to 23.13 cases per 100,000 from the late 1960s to the late 1990s, up 51.4% (Table 7).
| Table 7 Connecticut Cancer Incidence 0-4 During Bomb Tests/Reactor Operations by 4-Year Periods | |||
| Period of Bomb Testing | |||
| Period | Cases | Population | Rate |
| 1945-48 | 105 | 706,630 | 14.86 |
| 1949-52 | 139 | 803,118 | 17.31 |
| 1953-56 | 155 | 921,131 | 16.83 |
| 1957-60 | 175 | 1,082,820 | 16.16 |
| 1961-64 | 217 | 1,120,124 | 19.37 |
| Period of Reactor Operations | |||
| 1967-70 | 159 | 1,040,253 | 15.28 |
| 1971-74 | 159 | 934,719 | 17.01 |
| 1975-78 | 154 | 762,114 | 20.21 |
| 1979-82 | 120 | 755,805 | 15.88 |
| 1983-86 | 178 | 819,734 | 21.71 |
| 1987-90 | 192 | 911,497 | 21.06 |
| 1991-94 | 197 | 942,986 | 20.89 |
| 1995-98 | 202 | 873,425 | 23.13 |
| Source: Connecticut Tumor Registry |
B. Fairfield County as a Low-Risk Area
Fairfield County CT is located to the east-southeast of Indian Point, 18 miles away at its closest point in Greenwich and 45 miles away at its most distant in Stratford, making it the closest county in the state to Indian Point. The current county population is just over 900,000. It consists of 23 cities and towns, the largest of which are Bridgeport, Stamford, and Norwalk.
Fairfield County is not at apparent risk for health problems. Its population is better educated, has a higher income level, and has a lower unemployment rate than the nation, suggesting healthier living conditions and better health practices (Table 8A). In addition to adequate financial access to medical care, Fairfield’s location close to New York City gives its residents access to world class medical care.
| Table 8A Demographic Comparison, Fairfield County vs. US | ||
| Characteristic | Fairfield | United States |
| 2006 Estimated population | 900,440 | 299,398,484 |
| 2005 % Black | 10.7 | 12.8 |
| 2005 % Hispanic | 14.0 | 14.4 |
| 2005 % Asian | 4.1 | 4.3 |
| 2000 % Foreign Born | 16.9 | 14.4 |
| 2000 % HS grad > 25 | 84.4 | 80.4 |
| 2000 % Coll grad > 25 | 39.9 | 24.4 |
| 2000 % w Disability >5 | 16.0 | 19.0 |
| 2004 Median Household Inc | $60,790 | $44,334 |
| 2004 % Below poverty | 8.5 | 12.7 |
| 2006 % Unemployment | 3.8 | 4.6 |
| Sources: U.S. Department of Agriculture, www.ers.usda.gov/data/unemployment (for unemployment). U.S. Census Bureau, www.census.gov, state and county quick facts (all other data). |
C. Low Weight Births
As mentioned, the fetus and infant are most sensitive to the toxic effects of radiation exposure. The infant mortality rate in Fairfield County is below the national rate, as advances in medical treatment (most available to the affluent) save more lives than ever before. However, the incidence of underweight, premature births is not as likely to reflect advanced medical treatment, as basic prenatal care is sufficient for healthy outcomes. Table 8B shows that in recent years, the rate of Fairfield County babies born at very low weight (under 3.3 pounds) exceeds the U.S. rate by 3%, 12%, 3%, and 32% for whites, blacks, Asians, and Hispanics.
| Table 8B Underweight Births by Race, Fairfield County vs. US, 1996-2002 | |||||
| Race | Live Births | Rate/100 Births | % Co. vs. US | ||
| <3.3 lbs. | Total | County | US | ||
| Whites | 839 | 71538 | 1.17 | 1.14 | + 2.6% |
| Blacks | 375 | 10862 | 3.45 | 3.07 | +12.4% |
| Asian | 43 | 3953 | 1.09 | 1.06 | + 2.8% |
| Am. Indian | 4 | 138 | 2.90 | 1.12 | —– |
| TOTAL | 1261 | 86491 | 1.46 | 1.43 | + 2.1% |
| (Hispanic | 215 | 14379 | 1.51 | 1.14 | +32.4%) |
| Source: U.S. Centers for Disease Control and Prevention, http://wonder.cdc.gov, births. Excludes births with no stated weight. 3.3 pounds equals 1500 grams. Hispanics are can be in any racial group. |
D. Cancer Incidence
The Connecticut Tumor Registry began in 1935, making it the oldest in the United States. Table 9 compares recent (1998-2002) incidence of all cancers combined in Fairfield County with the U.S. The county rate is 8% and 7% above the U.S. for males and females, respectively. A total of 33,975 cancer cases were diagnosed among county residents during the five-year period.
| Table 9 Cancer Incidence, Fairfield County vs. US, 1998-2002 | ||||
| Area | Fairfield County | US | % Co. vs. US | |
| Cases | Cases/100000 | Cases/100000 | ||
| Males | 12222 | 613.4 | 567.0 | +8.2% |
| Females | 11753 | 450.2 | 421.9 | +6.7% |
| Source: Connecticut Tumor Registry, Department of Public Health, www.state.ct.us (Connecticut data). Surveillance Epidemiology and End Results system, www.seer.cancer.gov (U.S. data, nine states and cities representing 10% of U.S. population, including Connecticut). |
One of the most radiation-sensitive types of cancer is breast cancer in women. Breast cancer incidence has soared during the past two decades in the U.S., including in Connecticut. The 1998-2002 breast cancer incidence rate in Fairfield County is 6% higher than the U.S. rate (145.8 vs. 137.1 per 100,000). Nearly 800 Fairfield County women are diagnosed with the disease each year.
Within Fairfield County, there are variations in cancer incidence. Rates for the 12 cities and towns closest to Indian Point (and southeast, or directly downwind of prevailing winds during the colder months) were compared with those for the 11 more distant cities and towns. The most recent data available are from 1995-1999 (Table 10).
For all cancers, incidence for the 3.6% below the state rate for the 12 closest towns, but 7.7% below for the other towns. For breast cancer, the rate for the 12 closest towns equaled the state rate, but was 13.4% lower for the other towns. Differences are significant, and excess cancer cases in the five years equal 554 (all) and 327 (breast).
| Table 10 Incidence, All Cancers and Female Breast Cancer By Area of Fairfield County, 1995-99 | |||
| Area of County | Cases, 1995-99 | % Above/Below CT | |
| Actual | Expected* | ||
| All Cancers | |||
| Twelve Towns Nearest Indian Point | 12940 | 13420 | – 3.6% |
| Other Fairfield County | 8141 | 8817 | – 7.7% |
| Female Breast Cancer | |||
| Twelve Towns Nearest Indian Point | 2097 | 2094 | + 0.0% |
| Other Fairfield County | 1224 | 1413 | – 13.4% |
| * Expected cases if local rate equaled state rate. For all cancers, difference is significant (p<.001); excess cases = 554. For breast cancer, difference is significant (p<.001); excess cases = 327. Twelve towns are Darien, Easton, Fairfield, Greenwich, New Canaan, Norwalk, Ridgefield, Stamford, Trumbull, Weston, Westport, and Wilton. Source: Incidence of Selected Cancers in Connecticut by Town 1995-99, www.dph.state.ct.us/OPPE/hptumor.htm. |
E. Cancer Mortality
The type of cancer most extensively studied for risks of radiation exposure is childhood cancer. In the past two decades, the rate of Fairfield County children and adolescents (under 25) who died of cancer was 4.1% above the U.S. rate. This compares to a local rate 19.5% below the U.S. for all other causes (Table 11).
| Table 11 Mortality Rates, Cancer/Other Causes, Age 0-24, Fairfield County vs. U.S., 1979-2004 | ||||
| Area | Deaths | Ann. Pop. | Rate/100000 | % Co. vs. US |
| Cancer | ||||
| Fairfield County | 324 | 7389933 | 4.384 | + 4.1% |
| United States | 103939 | 2466824366 | 4.213 | |
| All Other Causes | ||||
| Fairfield County | 5197 | 7389933 | 70.33 | – 19.5% |
| United States | 2155190 | 2466824366 | 87.37 | |
| Source: U.S. Centers for Disease Control and Prevention, http://wonder.cdc.gov, underlying cause of death. Uses ICD-9 cancer codes 140.0-239.9 (before 1999) and ICD-10 cancer codes C00-D48.9 (1999 and after). Difference significant at p<.002. |
V. Studies of improved local health after reactor shutdown
A. Precedent – Atomic Bomb Test Halt
If Indian Point closes, no more radioactivity will be produced or released from the reactor core, even though the slow-decaying forms of radioactive waste will remain at the plant. Closing the reactor will reduce levels of these products in the environment and body. When above ground atomic bomb tests ceased, chemicals that decay quickly (such as Iodine-131, with a half life of eight days) virtually disappeared. Chemicals with a slower decay rate also dropped; Strontium-90 fell 75% in milk and 50% in bones from 1964-1970. (Source: Health and Safety Laboratory, U.S. Atomic Energy Commission. In: Radiation Data and Reports, monthly volumes, 1964-1970).
Reduced environmental radioactivity raises the question of whether disease rates also decline, especially among the more susceptible infant and children. Cancer incidence age 0-4 in Connecticut rose as large-scale bomb testing continued; from 1959 to 1962, new cases increased steadily from 41 to 60. But after testing ended, cases plunged, from 60 to 30 between 1962 and 1968 (Table 12). Cancer incidence to young children can be seen as one of the most sensitive indicators of harm from radiation exposure.
| Table 12 Annual Cancer Cases Diagnosed in Connecticut Children Age 0-4, 1959-1968 | |||
| Year | Cases | Year | Cases |
| During Bomb Testing | After Bomb Testing | ||
| 1959 | 41 | 1964 | 53 |
| 1960 | 47 | 1965 | 38 |
| 1961 | 46 | 1966 | 43 |
| 1962 | 60 | 1967 | 43 |
| 1963 | 58 | 1968 | 30 |
| Source: National Cancer Institute, Forty-five Years of Cancer Incidence in Connecticut: 1935-79. NIH Publication No. 86-2652. Bethesda MD: U.S. Department of Health and Human Services, 1986. |
B. Precedent – Nuclear Reactor Closing
Most radioactivity in the core of a nuclear reactor consists of chemicals that decay relatively quickly. A recent report calculated that a core meltdown just 20 days after shutdown of a fully operational reactor would mean 50% fewer cancer deaths and 81% fewer acute radiation deaths within 50 miles. Source: Lyman ES. The Impact of Nuclear Plant Shutdown on Severe Accident Consequences. Washington DC: Nuclear Control Institute, February 12, 2002.
Like atomic bomb test cessation, there may be a precedent for cancer reductions after nuclear reactors close and radioactive releases end. A 2002 journal article by the Radiation and Public Health Project examines downwind areas near reactors that closed from 1987-1998 that were at least 70 miles from any other nuclear plant. Cancer incidence age 0-4 fell near each plant (total of -24.8%), even though there was a slight increase in U.S. childhood cancer during this period (Table 13).
| Table 13 Change in Cancer Incidence Age 0-4 Before and After Reactor Closing Counties Downwind and <40 Miles of Closed Reactors | |||||
| Reactor | Year Closed | Counties Downwind and <40 Miles | |||
| LaCrosse | 1987 | LaCrosse, Vernon WI | |||
| Rancho Seco | 1989 | Amador, El Dorado, Placer, Sacramento CA | |||
| Fort St. Vrain | 1989 | Larimer, Weld CO | |||
| Big Rock Point | 1997 | Antrim, Charlevoix, Cheboygan, Emmet, Otsego MI | |||
| Maine Yankee | 1997 | Kennebec, Knox, Lincoln ME | |||
| Zion | 1998 | Lake IL; Kenosha, Racine WI | |||
| Reactor | Before | After | Cases/100,000 (No.) | % Change | |
| Close | Close | Before | After | ||
| LaCrosse | ’86-87 | ’88-94 | 40.0 ( 7) | 24.6 ( 15) | -38.5% |
| Rancho Seco | ’88-89 | ’90-96 | 24.0 (50) | 17.6 (153) | -26.9% |
| Fort St. Vrain | ’88-89 | ’90-96 | 20.3 (10) | 18.0 ( 32) | -11.7% |
| Big Rock Pt. | ’96-97 | ’98-00 | 45.0 ( 7) | 21.1 ( 5) | -53.1% |
| Me. Yankee | ’96-97 | ‘98-01 | 38.1 ( 8) | 27.2 ( 11) | -28.5% |
| Zion | ’97-98 | ’99-00 | 21.2 (32) | 19.7 ( 30) | – 7.0% |
| TOTAL | 24.7 (114) | 18.5 (246) | -24.8% | ||
| U.S. ANNUAL AVERAGE CHANGE, 1986-1998 | + 0.3% | ||||
| Sources: State cancer registries, in Mangano JJ et al. Infant Death and Childhood Cancer Reductions after Nuclear Plant Closings in the United States. Archives of Environmental Health 2002;57(10):23-32. |
C. Potential Cancer Reductions After Indian Point Closing
There are potential implications of these historical trends for Fairfield County if Indian Point were to cease operating. County rates of low weight births, cancer incidence, and cancer mortality often exceed the national rate, even though there are no obvious local risk factors. With about 4,000 and 2,000 Fairfield county residents being diagnosed with and dying of cancer each year, reduced exposures to radioactive chemicals could reduce those with cancer by hundreds each year. Such a change would be of great benefit to society, as it would save the enormous direct medical costs of treatment, and would allow more members of society to function productively. These risks should be considered in contrast with other forms of electricity that do not pollute, such as solar and wind power.