

|
|
|||||
| |
Nuclink: Journal of Current Radiation and Public Health Issues Volume 1, Number 4 THE CURRENT CANCER EPIDEMIC AND THE BABY BOOM GENERATION (continuted) By
Jay M. Gould, Director US WHITE FEMALE
BREAST CANCER MORTALITY
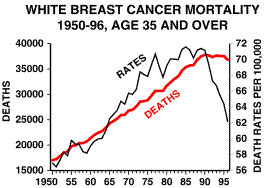
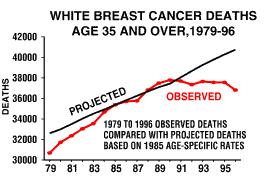
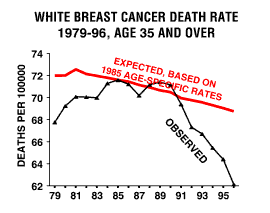
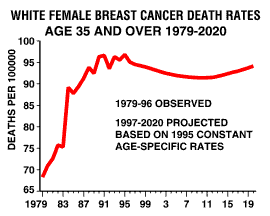
1950-2020 Figure 1 We shall show that both the anomalous drop in deaths and in the mortality rate are reflections of the immediate and delayed impact on female immune systems of low-level radiation. The situation is highlighted in Figures 2 and 3, in which we compare the observed number of deaths and the overall mortality rate since 1979, with projections of both, based on holding constant the 1985 observed age-specific rates for each age-group. Figure 2 By holding the 1985 mortality rates for each age group constant, we can ascertain what the annual number of breast cancer deaths and overall rate would have been each year if there had not been any change in the degree of environmental exposure present in 1985, especially to exposure to Chernobyl fallout arriving in May 1986. Thus, by holding these rates constant, all projected changes would merely reflect annual changes in the age composition since 1979. Figure 3 Figures 1, 2, and 3 show that the observed rise in the number of deaths and mortality rate from 1985 to 1990 was followed by a sudden apparent improvement in both observed indicators. If there had been no change in the 1985 age-specific rates, then according to Figures 2 and 3 we would expect about 40,000 deaths by 1996 rather than the observed number of 36,000. We would expect a rate of about 69 deaths per 100000 instead of the observed rate of 62. How can this be explained? The observed upsurge in deaths from 1985 to 1990 coincided with the arrival of Chernobyl fallout in 1986, and the decline after 1990 with the wearing off of its effects, which is also reflected in the sharp decline in the mortality rate after 1990. But even without Chernobyl, Figure 3 shows that there would have been a systematic decline in the projected mortality rate from 1980 to 1995, having nothing to do with Chernobyl nor its aftermath. Figure
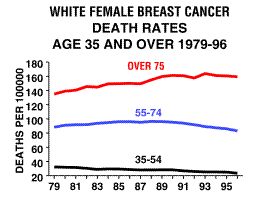
4 shows that the age-specific breast cancer mortality rates since
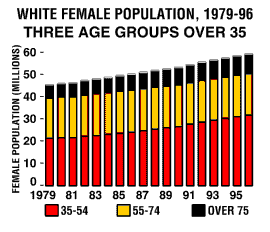
1979 for younger women aged 35 to 54 is generally about one third
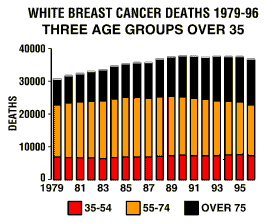
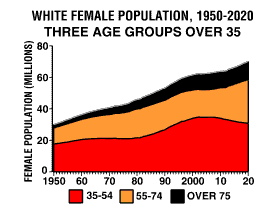
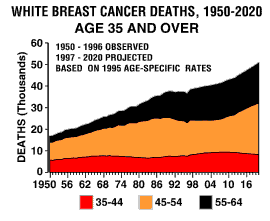
that of older women over the age of 75 Figure 4 Thus if the youngest age group is growing most rapidly, as is shown by Figure 5, then the increasing weight given them will be reflected as a decline in the overall mortality rate for all women over 35. This means that the observed post-1990 decline in the mortality rate will be short-lived both because baby boomers are getting older and the immediate effects of Chernobyl are wearing off. Figure 5 The sharp drop in the mortality rate from 1990 to 1996 reflects not only the decline in deaths among older women, but also another change. Figure 6 shows that deaths accounted for by younger women aged 35 to 54 did not share that decline, paradoxically enhancing the decline in the overall mortality rate. This is because their growing importance gives greater weight to their lower mortality rate. The continued rise in deaths of younger women after 1990 shown by Figure 6 raises a key question. Since the baby boomer women who swelled the ranks of the youngest age groups in the 1980s and 1990s will begin to reach the age of 55 in the year 2000, what will happen to the overall mortality rate for women over the age of 35 when aging baby boomer women reach the peak ages of cancer mortality? Figure 6 This question can be answered because the Census Bureau has projected the age composition of White and Black men and women for the years 1990 to 2020. We cannot of course predict what the age-specific mortality rates will be for each cohort after 1996, but we can project the change in the future overall rate and number of deaths by holding constant the age-specific rates of each age group achieved in 1995. Figure 7 displays the changing importance of the three major age groups of the White female population, as recorded by the Census Bureau from 1950 to 2020. Note that the sharp increase in the age group 35 to 54 in the years 1980 to 2000, will be succeeded by an equally sharp decline after 2000, when the baby boomer women will be over 55 and will increasingly dominate the ranks of older women. By 2020, women born in 1945 will reach the age of 75. Figure 7 Figure 8 records the projected number of white female breast cancer deaths obtained by applying constant 1995 age-specific mortality rates to each age group, which permits us to extend the observed number for the years 1950-1996. By the year 2020 the total number of deaths for White women over 35 could be 50000, 270 percent greater than the 1950 figure of 17000. Figure 8 Figure 9 shows that the projected overall declining mortality rate will change into an increase as baby boomer women grow older. But this projection assumes that there will be no worsening of the environmental situation after 1995 and also ignores the only possible reason for the baby boomer women being the first generation to die prematurely of breast cancer. We will be able to make some allowance for this after we review the experience of other cohorts in the following pages, particularly Black male and female baby boomers, who as we shall see have sustained far greater immune system damage than Whites. Figure 9 |
||||